
Infonex presents here brief analyses and key findings from field studies and quantitative datasets informing education in Malawi. Spotlight briefs aim to inform decision-makers and programme designers on both recent developments and gradual, longitudinal change in education. New briefs and charts appear here every few months, so we encourage you to return again to Spotlight.
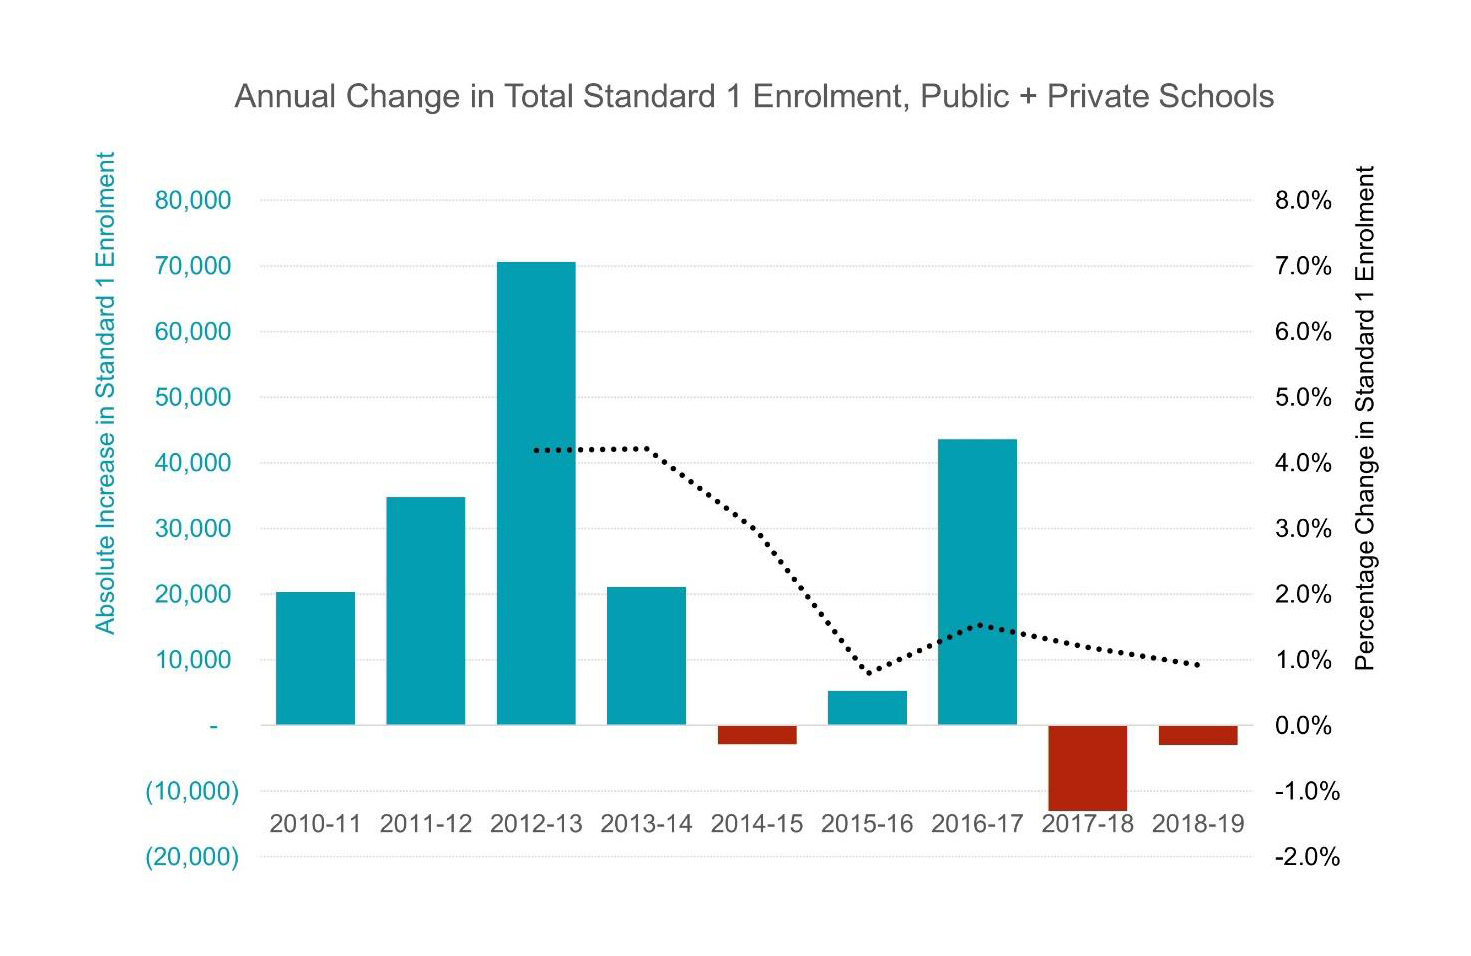
Since the 2010/11 school year, total student enrolment in Standard 1 – both new entrants and repeating students, public and private schools – has often changed markedly from one year to the next (Figure 1). After sharp increases each year from 2010/11 to 2012/13, total enrolment in Standard 1 slowed markedly and was lower than the preceding year in 3 of the next 5 school years (2014/15, 2017/18 and 2018/19); and only marginally higher in 2015/16. Then in 2016/17, Standard 1 enrolment jumped more than 4% -- the second largest increase since 2010/11.
Applying a 3-year moving average to these annual results shows an average annual increase of 0.8% to 1.5% in total Standard 1 enrolments in both public and private schools since 2015/16.
Both these sharp variations in total Standard 1 enrolment and the lower moving average in recent years want explanation. The annual results since 2014/15 might simply be “noise”, i.e. reporting errors and missing data.
Yet these national enrolment results mask wide variation in the direction and rate of change in Standard 1 enrolment from one year to the next in individual schools. For the MERIT Activity (USAID/Malawi), Infonex visited a national indicative sample of 86 public primary schools in 2016/17 and 2017/18 to conduct national assessments. From each school, Infonex recorded Standard 1 enrolment data.
Figure 2 presents the findings. Key observations include:
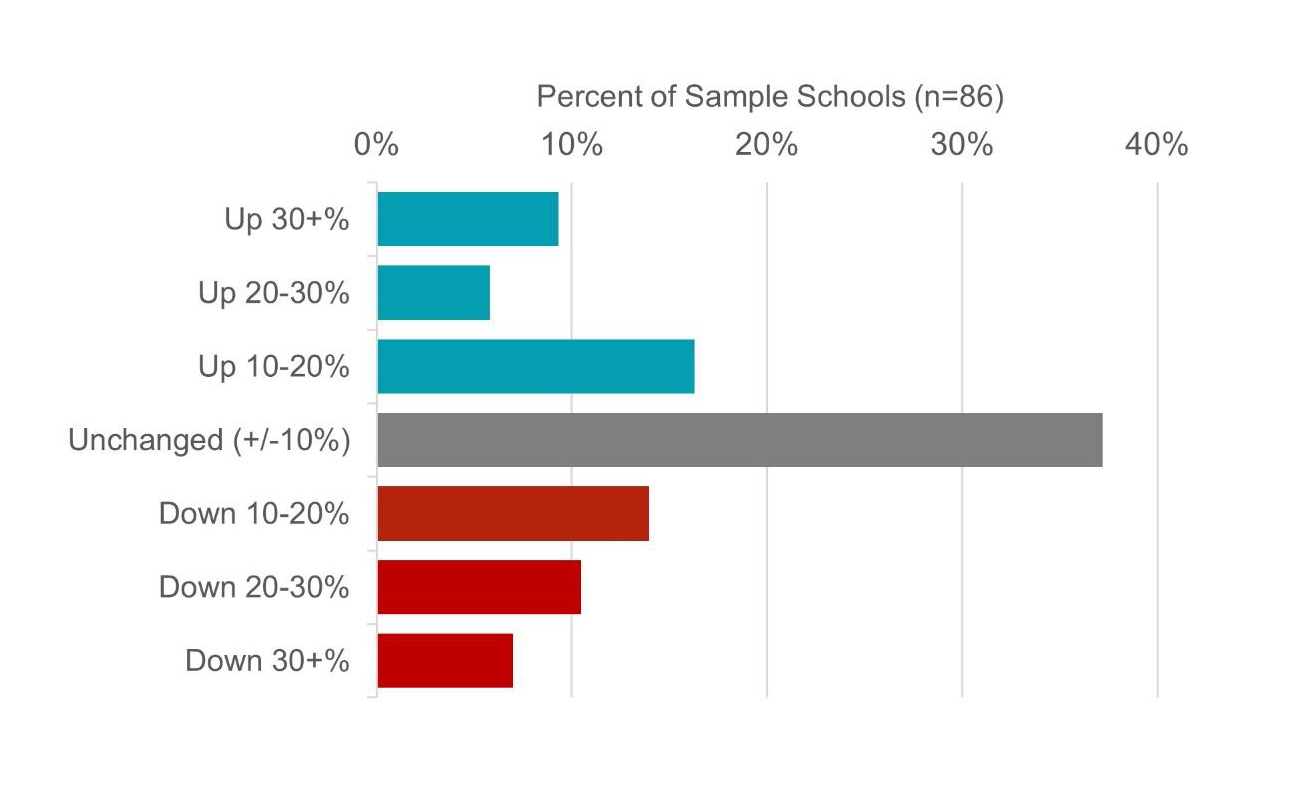
Large numbers of public primary schools in this sample experienced wide swings in annual Standard 1 enrolment between these two years. Were these 2 years exceptional? Did Standard 1 enrolments in these schools return to “average” variation in subsequent years? What were the reasons – local, regional – for these marked shifts in annual enrolments?
The findings suggest that local factors and community events may profoundly impact Standard 1 enrolments in many schools in any given year. These outcomes beg greater understanding. They have large implications for allocating books and learning materials to schools and achieving improved early learning outcomes in Standard 1.
Infonex Malawi will report further on enrolment in the early standards from follow-up analyses of EMIS and randomized sample school data in forthcoming Spotlight Information! Briefs.